First-time TaskPaper scripter (with web apps coding skills some 3 years out of date).
I am facing two difficulties hooking the Safari-based Javascript context debugger up with TaskPaper.
When working in the Script Editor, I often receive a warning that the script could not be autosaved because it has been changed by another application, following which I am given the option to save anyway or revert. Indeed, opening the script in another editor at that point (e.g. Sublime Text), I notice that the several non-printable characters have been prepended and appended to the script. Why? Could it be because of a debugger statement that I have inserted in the script? Probably not, because other scripts, which lack such statements, are likewise flanked by non-printable characters.
Possibly but not necessarily in connection to #1, the Javascript context inspector appears empty. I cannot view any of the objects of the Taskpaper context. I am only able to dump output from the TaskPaper context into the console via console.log statements.
But from your questions is sounds like you may have already gotten that far.
Odd, I’m not really sure. I don’t think the debugger statement would have anything to do with it.
Odd things might happen if you try to edit the code in the “Web Inspector” (Safari’s web debugger view), but I don’t remember seeing any issues in Script Editor. If it continues to be a problem maybe describe a simple reproducible scenario and I might be able to spot something.
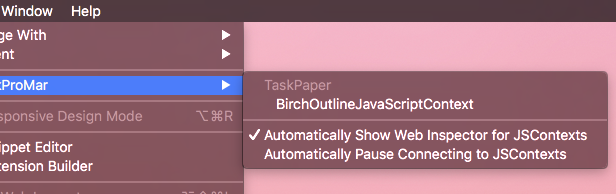
In the Safari debug menu check both “Automatically Show Web Inspector …” and “Automatically Pause Connecting …”. Checking that second option will show you TaskPaper’s javascript code.
I think the ‘couldn’t be saved’ problem may arise from differences in the way in which different editors save (and try to open) .scpt files.
I generally use Atom with the Run Script package to edit and test .scpt files, and I generally see problem that if I subsequently try to open and save the same .scpt file in Script Editor.
The immediate fix, of course, is just to Save As or copy-paste to a new file.
The source of the problem - not sure - my understanding is that compiled .scpt files are essentially saved in a .plist format. Perhaps there is scope for confusion when a file with an .scpt extension is saved as raw text, or maybe there can be some subtle variation in the expectations of the .plist content ?
@complexpoint, thanks. Good to know about the Atom package. Will try as the Script Editor is abhorrent.
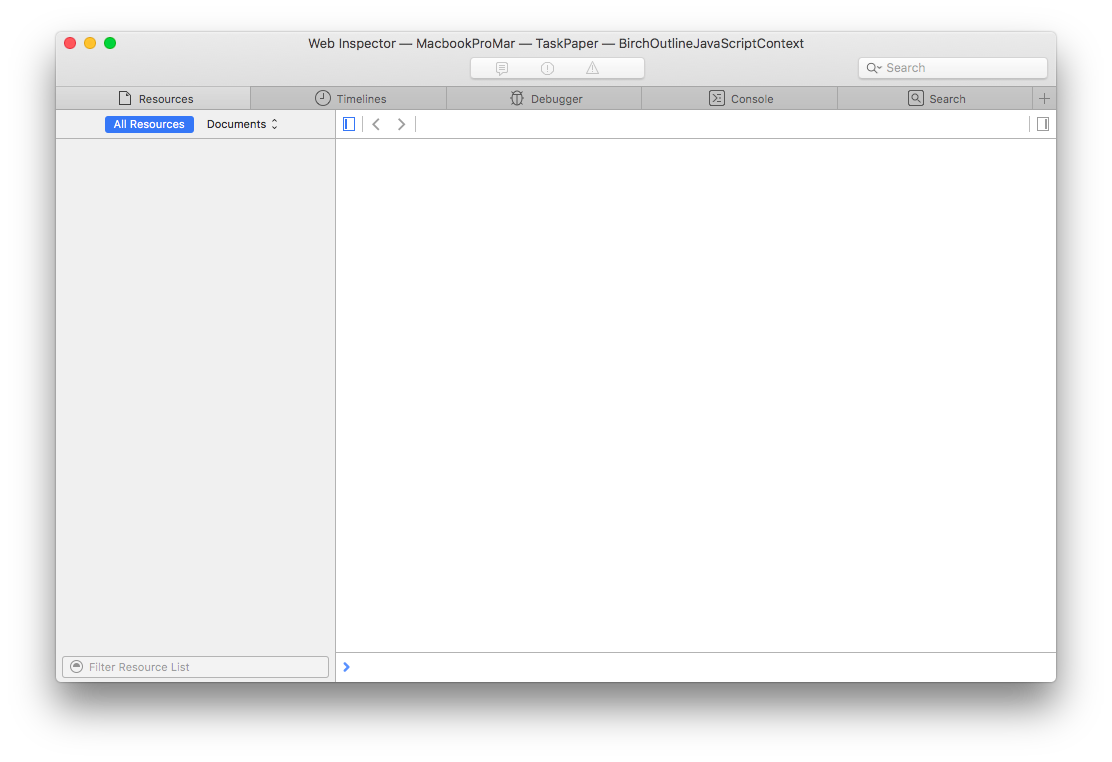
@jessegrosjean I tried that option to no avail. I still see nothing under resources, cannot inspect the Taskpaper DOM, there is no timeline, etc. Only the console works, and then only via explicit console.log() statements in the script code… Clearly I must be doing something wrong?
Most of what you say here is expected … TaskPaper’s script context is very limited compared to a standard web browsers DOM. Also more limited then a Node.js context. There is no visible DOM, Resources, or Timelines. Instead what checking that option should give you is a debugger stopped at the start of TaskPaper’s code. Should like like this:
var bircheditor =
/******/ (function(modules) { // webpackBootstrap
...
Do you see that when you start TaskPaper after having checked both those menu items in Safari’s debug menu?
Thanks a lot, @jessegrosjean. Yes, it works. I was expecting to be able to inspect at least the CSS and HTML elements of the Taskpaper DOM, but now it’s all clear. I think I was also opening the Safari debugger after Taskpaper, not the other way around.