Difficulty in setting up a script debugging environment

I’ve been using TaskPaper for years now (and am a big fan), but only recently tried my had at scripting it.
Setup: TaskPaper Version 3.8.16 (475) on Big Sur 11.2.3
I have the version of TP bought on the TP website (not the Mac App Store version).

The page Creating Scripts (Creating Scripts · GitBook) in the TP documentation mentions two items that I am not able to find:

  1. The “TaskPaper’s JavaScript Context” section mentions:
    In the TaskPaper JavaScript context:
    … (5) Your can use TaskPaper’s Window > JavaScript Debugger to debug your script.
    => However in my setup, there is no JavaScript Debugger menu item under TP’s Window menu

  2. The “Debugging TaskPaper’s JavaScript Context” section mentions:
    Choose Safari > Develop > Computer > TaskPaper > BirchOutlineJavascriptContext
    => However I don’t see TaskPaper or BirchOutline under MyComputer

I’ve already followed the steps in Safari to show the Developer Menu. And I have Safari and TP, both open at the same time.
Due to this, I am having problems getting any further with scripting TaskPaper.
Happy to have any help with this. Thanks.

I just testing and seems not to work for me either. I expect some combination of notarization, hardened runtime, security measures must have broken things. I’ll see if I can find a fix.

Any update on this?
I’m also trying to setup a debugging environment.
Switched from App Store to Website version and followed the guide instructions.
Still Taskpaper is not showing up in Safari Develop Tab.

Seems to be working here.

  • TaskPaper Version 3.8.18 Preview (478)
  • macOS 11.6.5
  • Safari 15.4
  1. Safari > Preferences > Advanced > Show Develop menu in menu bar
  2. Develop > [host name] > Automatically show Web Inspector for JS Contexts
  3. debugger; keyword in source
Expand disclosure triangle to view sample JS source
(() => {
    "use strict";

    const TaskPaperContext = (editor, options) => {

        debugger;

        return 2 + 2;
    };


    return Application("TaskPaper").documents.at(0)
        .evaluate({
            script: `${TaskPaperContext}`,
            withOptions: {}
        });
})();

Result:
Safari > Window > Web Inspector

Tho to be honest, I haven’t used the debugger much since I gave up using var and let.

If everything is a const, and all values are computed by

  • .map
  • .flatMap
  • .reduce
  • .reduceRight
  • .filter

there just isn’t any mutating state to trip you up and get you tracing …

1 Like

@FlowBo @complexpoint I wonder if difference is macOS version. I’m on 12.3 and debugger doesn’t seem to be showing :\

1 Like

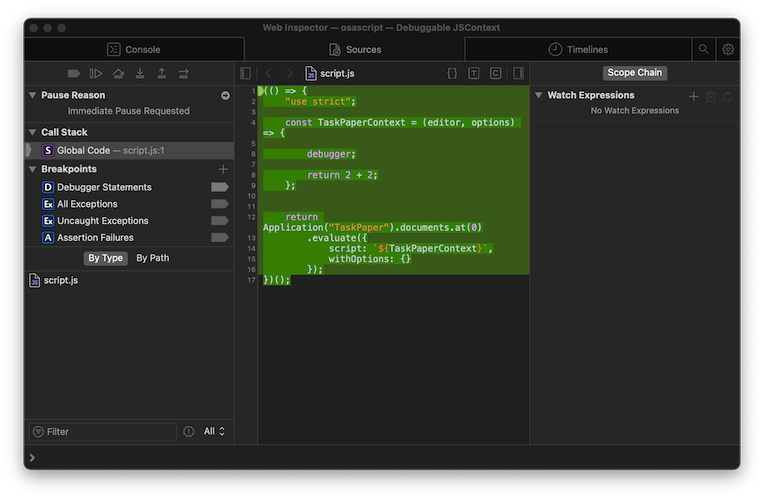
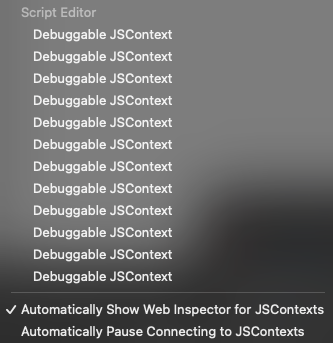
Okay I got the inspector open and connected to Debuggable JSContext. But only ofter running the script once with the Debugger and running the code multiple times.
Screen Shot 2022-04-04 at 21.16.23
The Code from @complexpoint executes but I get a Error: Can’t convert types
And I can’t manage to console.log() anything.

(() => {
    "use strict";

    const TaskPaperContext = (editor, options) => {
		console.log("Hello debugger");
        debugger;
		console.log("Bye debugger");		
        return 2 + 3;
    };


    return Application("TaskPaper").documents.at(0)
        .evaluate({
            script: `${TaskPaperContext}`,
            withOptions: {}
        });
})();

Guess I would need a proper debugging Taskpaper/JS guide :grinning:

Seeing no errors here in tracing your amended code there,
but not sure what versions of macOS, Safari, TaskPaper you are running …

OSX 12.2.1
TaskPaper 3.8.17
Safari 15.3

It does look like a macOS 11 vs 12 issue then.

Apple seems to periodically (and I would guess inadvertently) pull the rug away from under JSContext debugging in Safari.